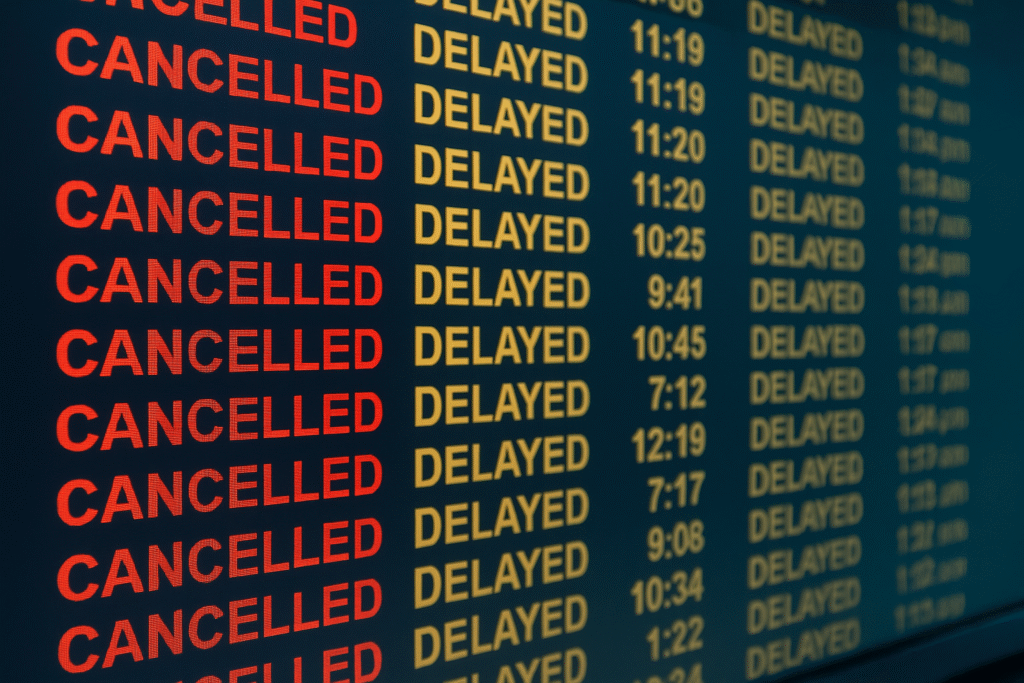
Travelers across the United States faced intense frustration as more than 4,500 flight delays and 191 cancellations were recorded in a single day, disrupting schedules nationwide. The wave of delays and cancellations impacted both major airline carriers and regional operators, spreading chaos across major hubs like Hartsfield-Jackson Atlanta International, Charlotte Douglas, Reagan National, and Piedmont Triad, as well as smaller regional airports.
The disruptions, spanning several time zones and affecting thousands of passengers, reveal the growing pressure the aviation industry faces during peak travel periods. Operational inefficiencies, crew shortages, and rising passenger demand have created a perfect storm for one of the most challenging travel seasons in recent memory.
Airlines Struggle Amid Staffing and Operational Challenges
Among the most affected carriers were Piedmont (AAL) and PSA Airlines (AAL), which reported 2% and 7% cancellations, respectively. Piedmont also faced a staggering 40% delay rate, while PSA Airlines dealt with delays on 37% of its operations. Even large legacy airlines like American Airlines and Delta weren’t spared, with hundreds of delayed flights recorded despite lower cancellation percentages.
Summary of Major Airline Disruptions:
| Airline | Cancellations (%) | Delays (%) |
|---|---|---|
| Piedmont (AAL) | 2% | 40% |
| PSA Airlines (AAL) | 7% | 37% |
| American Airlines | 0% | 21% |
| Alaska Airlines | 1% | 17% |
| Delta Air Lines | 1% | 10% |
| JetBlue | 0% | 26% |
| SkyWest | 0% | 19% |
| Envoy Air | 0% | 19% |
While some carriers maintained low cancellation rates, the sheer volume of delayed flights still severely impacted passengers’ itineraries. JetBlue, for example, reported only a single cancellation but had delays across more than a quarter of its scheduled services.
Airport Operations Buckle Under Pressure
Flight disruptions weren’t limited to the airlines. The airports themselves also experienced varied levels of service breakdowns, particularly in managing peak hour traffic and weather-related issues. Reagan National (DCA) reported the highest cancellation rate among major airports at 4%, along with a delay rate of 24%. Chicago O’Hare and Charlotte/Douglas International were also among the hardest hit, with hundreds of delayed flights logged at each location.
Key Airports Impacted by Cancellations and Delays:
| Airport | Cancellations (%) | Delays (%) |
|---|---|---|
| Reagan National (DCA) | 4% | 24% |
| Charlotte/Douglas Intl (CLT) | 1% | 24% |
| Chicago O’Hare Intl (ORD) | 0% | 23% |
| Hartsfield-Jackson Atlanta (ATL) | 0% | 12% |
| Los Angeles Intl (LAX) | 0% | 11% |
In contrast, while some major hubs like Hartsfield and LAX recorded lower cancellation rates, they still struggled with a high number of delayed departures, impacting tight travel connections and increasing congestion.
Regional Airports Bear the Brunt
Smaller and regional airports were disproportionately affected by cancellations. Charlottesville-Albemarle (CHO) experienced a 6% cancellation rate, while Schulz-Sonoma County (STS) and Rogue Valley International (MFR) reported 8% and 7% respectively. These figures highlight the vulnerability of smaller facilities that have fewer resources to absorb operational shocks or sudden increases in passenger volume.
Smaller Airports with Highest Disruption Rates:
| Airport | Cancellations (%) | Delays (%) |
|---|---|---|
| Schulz-Sonoma County (STS) | 8% | 22% |
| Aspen-Pitkin County (ASE) | 15% | 20% |
| Charlottesville-Albemarle (CHO) | 6% | 20% |
| Rogue Valley Intl (MFR) | 7% | 13% |
These challenges indicate a growing need for strategic investment in regional infrastructure and staffing, especially during holiday and peak travel seasons when smaller airports struggle to cope with increased operational demands.
Destination Airports Show Growing Strain
Flight destinations were just as impacted, with travelers arriving at locations such as Charlotte, Reagan National, and Charlottesville facing significant delays. Lynchburg Regional Airport and Juneau International also recorded some of the highest cancellation percentages.
Top Affected Destination Airports:
| Airport | Cancellations (%) | Delays (%) |
|---|---|---|
| Charlottesville-Albemarle (CHO) | 9% | 22% |
| Lynchburg Rgnl (LYH) | 10% | 15% |
| Reagan National (DCA) | 5% | 18% |
| Charlotte/Douglas Intl (CLT) | 2% | 23% |
| Charleston Intl/AFB (CHS) | 1% | 18% |
The ripple effects of delays at origin airports resulted in cascading disruptions at key destinations, creating extended wait times for baggage, shuttle services, and connecting flights.
A Wake-Up Call for the Airline Industry
The scale of the current disruptions serves as a reminder of the fragility of the U.S. aviation infrastructure. With increasing travel demand, airline carriers and airports must work toward boosting operational resilience. This includes:
- Increasing staffing at critical operation points such as air traffic control and ground handling.
- Investing in automated systems to reduce human error and manage tight schedules.
- Implementing better contingency planning for high-demand periods.
Traveler Tips During Flight Disruptions
As delays and cancellations continue to challenge the system, travelers are encouraged to:
- Check flight status regularly before arriving at the airport.
- Consider travel insurance that covers flight changes and cancellations.
- Use airline apps for real-time updates and rebooking.
- Maintain flexible travel plans, especially during peak periods.
Conclusion
The recent wave of over 191 cancellations and 4,506 delays underscores the ongoing strain in the U.S. air travel ecosystem. With a wide range of carriers and airports impacted, passengers are advised to stay informed, prepared, and patient. As the industry works toward long-term solutions, strategic enhancements in staffing, scheduling, and airport operations will be crucial to reducing future travel disruptions and restoring confidence among travelers.
For more travel news like this, keep reading Global Travel Wire