n July 2025, the U.S. hotel industry saw a modest pullback in key performance metrics even as top-tier cities held steady. National hotel occupancy fell to 68.2%, a one-point decline from last year. Meanwhile, the average daily rate (ADR) dipped slightly to $161.90, and revenue per available room (RevPAR) dropped by 1.1%, showing that while pricing stayed mostly stable, demand lagged behind.
National Snapshot: Softening Demand and Price Pressures
July’s slowdown marks the fifth consecutive monthly decline in occupancy, signaling a broader softening in traveler demand. Weakness in RevPAR suggests that hotels, while maintaining price levels, are struggling to fill rooms consistently across the nation.
Still, not all markets fared equally. Major cities—especially New York—continued to outperform, driven by business travel and tourism.
City Showcases: Resilient Metropolises Hold Strong
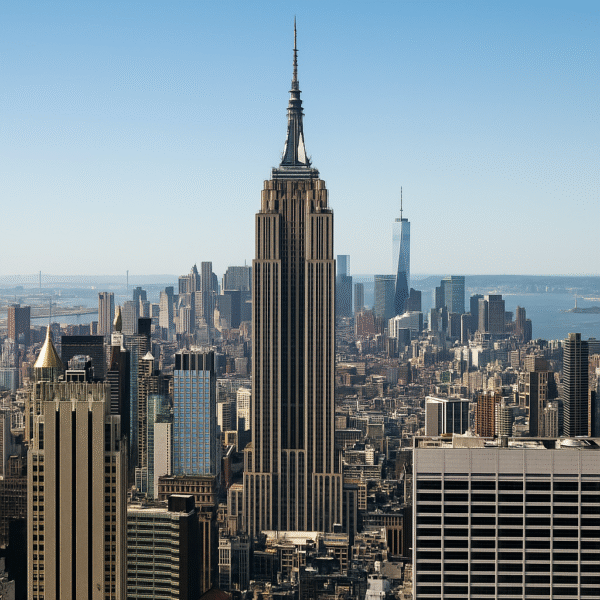
- New York City reported the highest occupancy among the top 25 hotel markets, at 85.2%, underscoring its enduring allure.
- San Francisco made notable gains in weekly metrics earlier in the summer, with occupancy and room rates on the rise during key event weeks.
- Chicago and Los Angeles, while showing resilience, faced temporary dips due to tough comparisons with past spikes tied to events or recoveries. A deeper dive revealed that Chicago’s business market remained robust, even as RevPAR took a hit against last year’s convention-driven demand.
Regional Variations: Who’s Lagging Behind
Markets like New Orleans and Phoenix registered among the lowest occupancy figures—just 53.9% and 55.3%, respectively—highlighting the uneven recovery across regions and lighter demand for select destinations during this period.
Broader Trends and Market Drivers
Analysts attribute the general slowdown to several factors: sub-par business travel recovery, rising supply in select markets, and evolving travel preferences—especially favoring alternatives like vacation rentals and boutique stays. Supply-side pressures, combined with cautious consumer sentiment, also dampened momentum.
At the same time, limited new development and higher performance in leisure and luxury segments offer a silver lining. Still, hoteliers may need to lean on creative tactics—promotions, differentiated experiences, and targeted outreach—to nudge demand forward.
What’s Next? Forecasts and Preparedness
Looking ahead, analysts anticipate additional volatility through late 2025, particularly as difficult year-over-year comparisons persist in business-heavy locales.
Hotel operators are advised to monitor evolving trends—like potential rebounds in midweek business booking as office attendance rises—and to adapt swiftly with strategic pricing, guest experience enhancements, and focused marketing.
Ultimately, sustained resilience in places like New York, San Francisco, and other core cities may buoy the broader industry as it navigates the slowdown toward year-end.
Snapshot Table: July 2025 Hotel Metrics
| Metric | Value (July 2025) | Year-over-Year (YoY) Change |
|---|---|---|
| Occupancy Rate | 68.2% | –1.0 percentage point |
| Average Daily Rate | $161.90 | –0.1% |
| Revenue/Available Room | $110.37 | –1.1% |
| Top Market Highlights | NYC at 85.2% occupancy | Slight dips in ADR & RevPAR |
Wrap-Up
July 2025 brought a slight cool-off across the U.S. hotel market, with occupancy and revenues softening amid softer demand. Nonetheless, major urban centers—especially New York, San Francisco, Chicago, and Los Angeles—continued to demonstrate business and tourism strength.
Stratified performance across markets indicates that strategic innovation and targeted outreach will be essential for hotels to navigate the remainder of the year successfully. Let me know if you’d like an expanded analysis of leisure vs. business trends or a breakdown by hotel segments.
For more travel news like this, keep reading Global Travel Wire

